Featured image of post tracer模块

tracer模块

背景

最近在使用opensips的wss模块,前端使用jssip封装webrtc

正式环境中web前端不会开启console打印webrtc交互信令,当需要排查问题时,此时会变得异常困难。

世面上能用的工具都试过了,不管是sngrep还是wireshark抓包,都无法解析wss信令(wireshark即便是有tls的公私钥,也无法解析)。

ssldump 一方面没有centos的包,需要用容器做镜像(如果感兴趣后续可以介绍),另一方面,它必须从建立连接时开始抓包,无法抓到建立连接之后的信令。

opensips的tracer模块,就能很好解决这个问题。官方文档:tracer模块

opensips的版本信息:

opensips 3.3.10 (x86_64/linux)

trace设置方式

  • trace_id的设置主要有4个方式:
  1. 写DB

    modparam("tracer", "trace_id","[tid]uri=mysql://xxxx:xxxx@10.10.10.10/opensips;table=sip_trace;") 这个会直接把数据插入到数据表sip_trace中,这个opensip的DB默认表已有此表结构。

  2. 写文件

    modparam("tracer", "trace_id","[tid]uri=file:/tmp/trace.log") 这个会直接把数据写入到文件/tmp/trace.log中,需要设置file_mode

  3. 写入hep_server端

    modparam("tracer", "trace_id","[tid]uri=hep://10.10.10.10:xxxx") 或者 modparam("tracer", "trace_id", "[tid]uri=hep:hid")

  4. 写入syslog

    modparam("tracer", "trace_id","[tid]uri=syslog:local0:-1")

  • 调用trace功能

官方接口介绍:

1
trace(trace_id, [scope], [type], [trace_attrs], [flags], [correlation_id])

主要参数说明:

  1. scope

    • ’m/M’ 无状态模式下,追踪消息
    • ’t/T’ tm模块如果没加载,追踪事务,包括 in和out的请求以及内部的回复
    • ’d/D’ 追踪dialog
    • ‘b/B’ 追踪B2B信息
  2. type

    • sip 追踪sip信令
    • xlog 追踪xlog里的信息(dialog, transaction, B2B)
    • rest 追踪rest 接口信息

实战配置

统一调用方法:

1
2
3
4
5
6
if (is_method("REGISTER")) {
    trace("tid", "t","sip");
}
if (is_method("INVITE") && !has_totag())) {
    trace("tid", "d", "sip");
}

写DB

配置:

1
2
3
loadmodule "db_mysql.so"
loadmodule "tracer.so"
modparam("tracer", "trace_id","[tid]uri=mysql://opensips:opensipsrw@172.16.3.121:3306/opensips;table=sip_trace;")

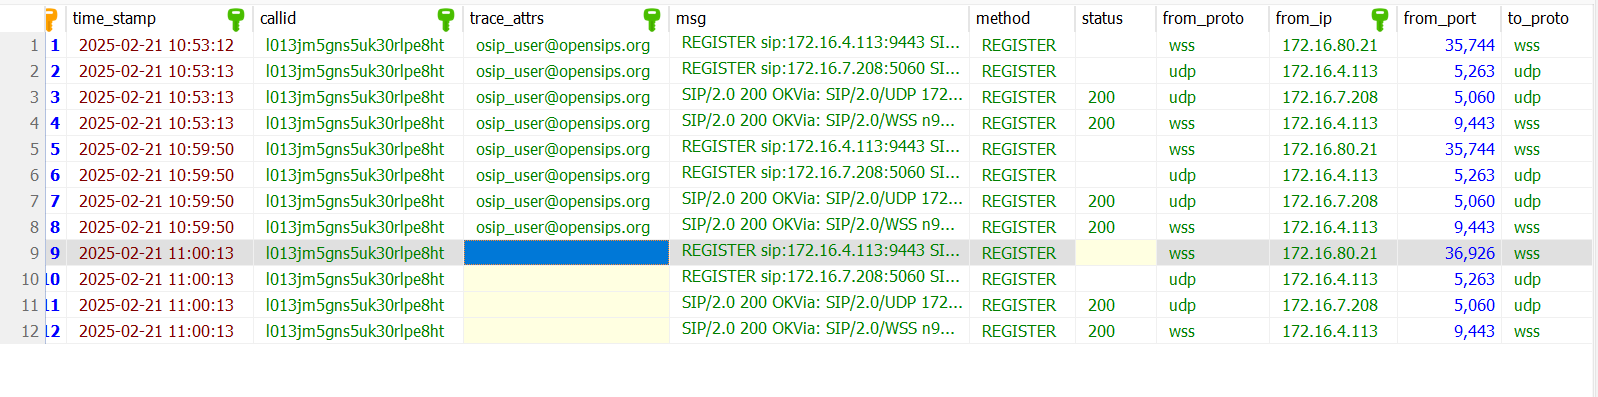
此时就可以在数据表sip_trace中查看到trace信息了。 mysql

写文件

配置:

1
2
3
loadmodule "tracer.so"
modparam("tracer", "trace_id","[tid]uri=file:/tmp/trace.log")
modparam("tracer", "file_mode", "0644")

此时就可以在/tmp/trace.log文件中查看到trace信息了。

 1
 2
 3
 4
 5
 6
 7
 8
 9
10
11
12
13
14
15
16
17
18
19
20
21
22
23
24
25
26
27
28
29
30
31
32
33
34
35
36
in wss 2025-02-21 11:05:20 172.16.80.21:37885 -> 172.16.4.113:9443
REGISTER sip:172.16.4.113:9443 SIP/2.0
Via: SIP/2.0/WSS n98f6pr114j5.invalid;branch=z9hG4bK1737010
Max-Forwards: 68
To: <sip:88880022@172.16.4.113:9443>
From: "88880022" <sip:88880022@172.16.4.113:9443>;tag=v68n10kvr9
Call-ID: l013jm5gns5uk30rlpe8ht
CSeq: 18 REGISTER
X-SBC: Dinstar Mediant
Contact: <sip:88880022@n98f6pr114j5.invalid;transport=ws>;+sip.ice;reg-id=1;+sip.instance="<urn:uuid:a17d9354-7175-46b9-a17a-d86a73ebb150>";expires=600
Expires: 600
Authorization: Digest algorithm=MD5, username="88880022", realm="huawei", nonce="856ef8e5f85686a917325343ffe6f9bd", uri="sip:172.16.4.113:9443", response="5b9367e936dcdb9464b2793fdd849bc9"
Allow: INVITE,ACK,CANCEL,BYE,UPDATE,MESSAGE,OPTIONS,REFER,INFO,NOTIFY,SUBSCRIBE
Supported: path,gruu,outbound
User-Agent: Dinstar WebRTC SDK. Simple phone 1.17.0 Chrome/133
Content-Length: 0


out udp 2025-02-21 11:05:20 172.16.4.113:5263 -> 172.16.7.208:5060
REGISTER sip:172.16.7.208:5060 SIP/2.0
Via: SIP/2.0/UDP 172.16.4.113:5263;branch=z9hG4bKaa1c.91292206.0;i=cf637872
Via: SIP/2.0/WSS n98f6pr114j5.invalid;received=172.16.80.21;branch=z9hG4bK1737010
Max-Forwards: 68
To: <sip:88880022@172.16.4.113:9443>
From: "88880022" <sip:88880022@172.16.4.113:9443>;tag=v68n10kvr9
Call-ID: l013jm5gns5uk30rlpe8ht
CSeq: 18 REGISTER
X-SBC: Dinstar Mediant
Contact: <sip:88880022@172.16.4.113:5263>;expires=600
Expires: 600
Authorization: Digest algorithm=MD5, username="88880022", realm="huawei", nonce="856ef8e5f85686a917325343ffe6f9bd", uri="sip:172.16.4.113:9443", response="5b9367e936dcdb9464b2793fdd849bc9"
Allow: INVITE,ACK,CANCEL,BYE,UPDATE,MESSAGE,OPTIONS,REFER,INFO,NOTIFY,SUBSCRIBE
Supported: path,gruu,outbound
User-Agent: Dinstar WebRTC SDK. Simple phone 1.17.0 Chrome/133
Content-Length: 0

写入hep_server端

本次测试使用的是 hep-server:hep-connect

web前端显示:siphub

配置:

1
2
3
4
5
socket=hep_udp:172.16.4.113:6000
loadmodule "tracer.so"
loadmodule "proto_hep.so"
modparam("proto_hep", "hep_id","[hid] 172.16.4.111:9060;transport=udp;version=3")
modparam("tracer", "trace_id","[tid]uri=hep:hid")
  • socket是opensips 客户端发送proto_hep数据的端口
  • hep_id是hep_server的监听端口

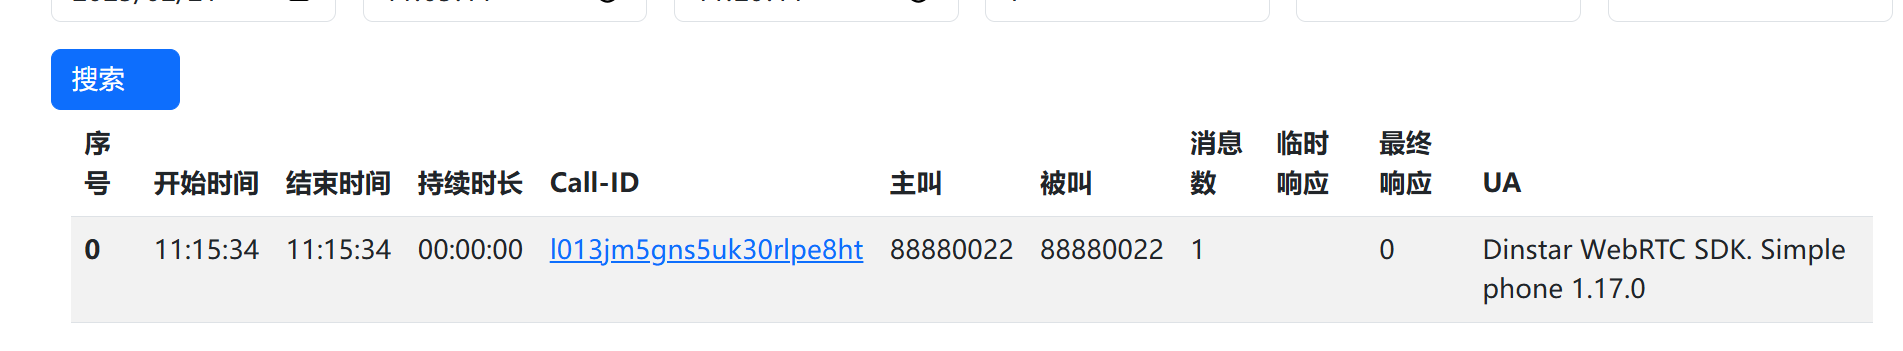
此时打开siphub的web页面:http://172.0.0.1:3000/ 可以看到: siphub

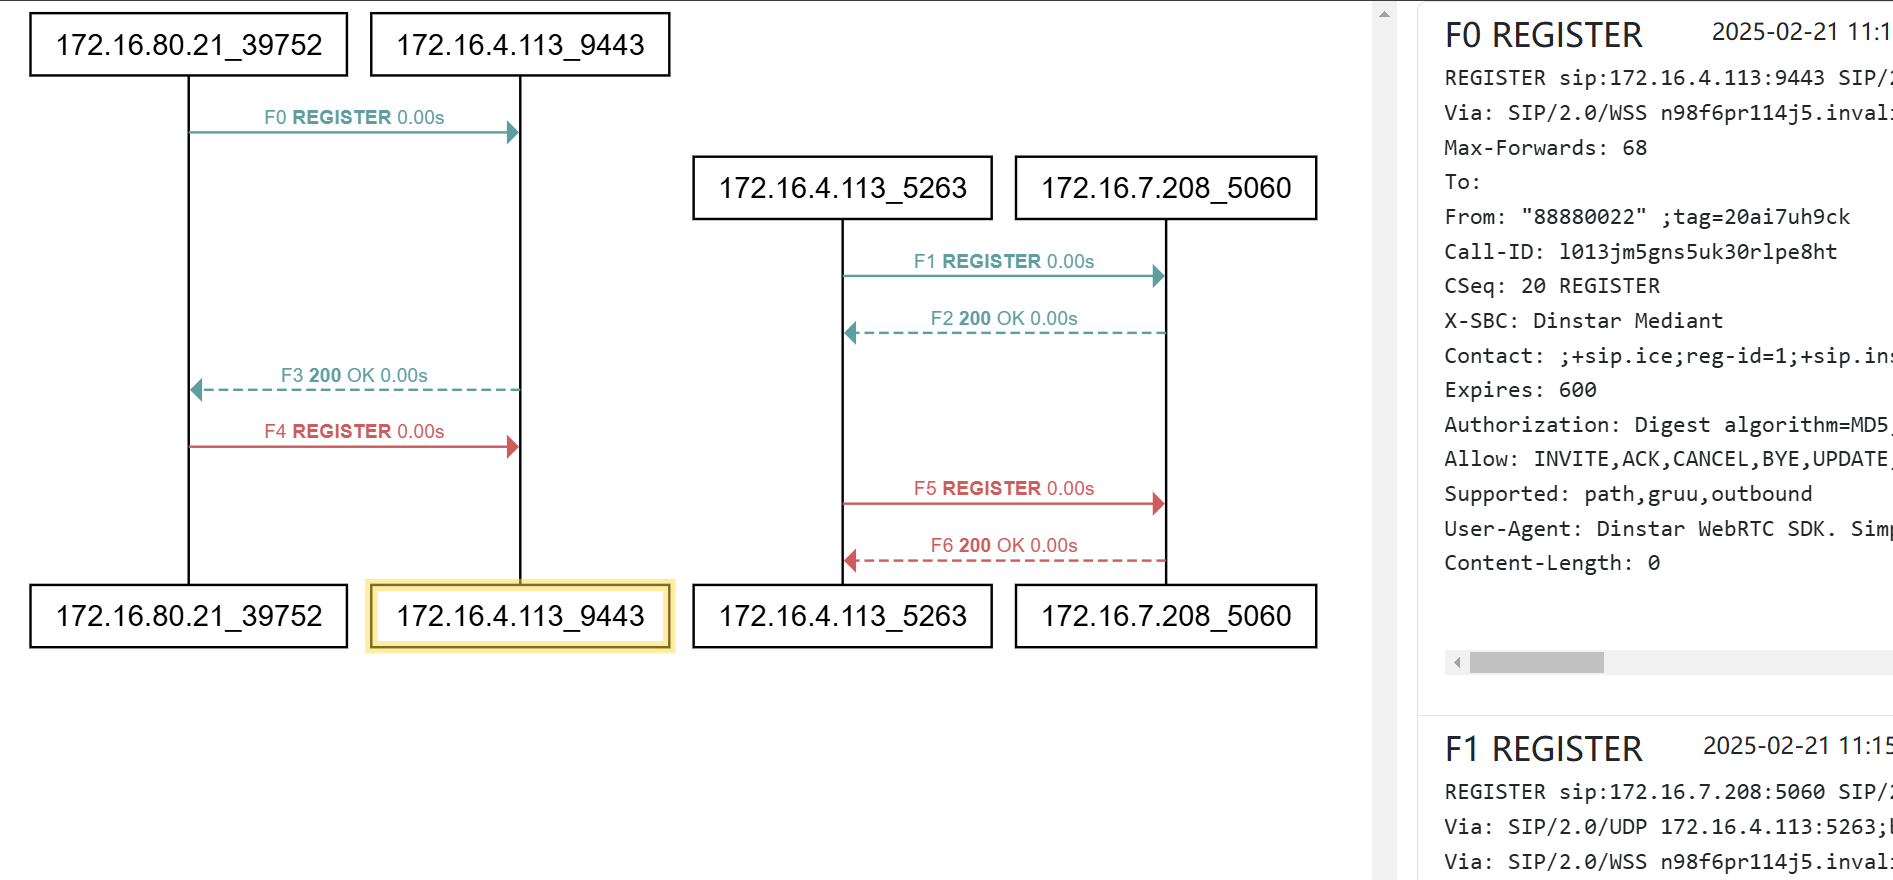
点击Call-ID 可以看到详细的sip信令信息: siphub

写入syslog

1
2
3
4
5
6
7
8
log_level=3
xlog_level=4
log_stderror=no
log_facility=LOG_LOCAL0
loadmodule "tracer.so"
modparam("tracer", "syslog_default_facility","LOG_LOCAL0")
modparam("tracer", "syslog_default_level", 4)
modparam("tracer", "trace_id","[tid]uri=syslog")

这个功能暂时未测成功,opensips的日志输出到syslog,但是在日志中未看到trace信息。

总结

通过上述的方法,可以看到很容易跟踪sip信令。

  1. 如果需要对opensips做监控,那么使用hep-server是比较合适的选择。
  2. 临时性排查问题,一般的sip传送方式tcp/udp/ws,使用sngrep都能搞定。
  3. 针对wss信令,使用trace写文件,可能是比较轻量的选择。
本博客已稳定运行
发表了26篇文章 · 总计45.09k字
本站总访问量 次 · 您是本站第 位访问者
粤ICP备2025368587号-1| 使用 Hugo 构建
主题 StackJimmy 设计